MSI Afterburner Introduces Advanced Voltage/Frequency Curve Heat Map for GPUs
MSI Afterburner, a leading GPU overclocking and monitoring utility, is testing a new voltage/frequency (V/F) curve editor featuring an integrated heat map. This innovative tool is designed to give users deeper insights into how their graphics card manages voltage and frequency under different workloads, enhancing both performance tuning and system stability.
Visualizing GPU Boost Behavior with the V/F Heat Map
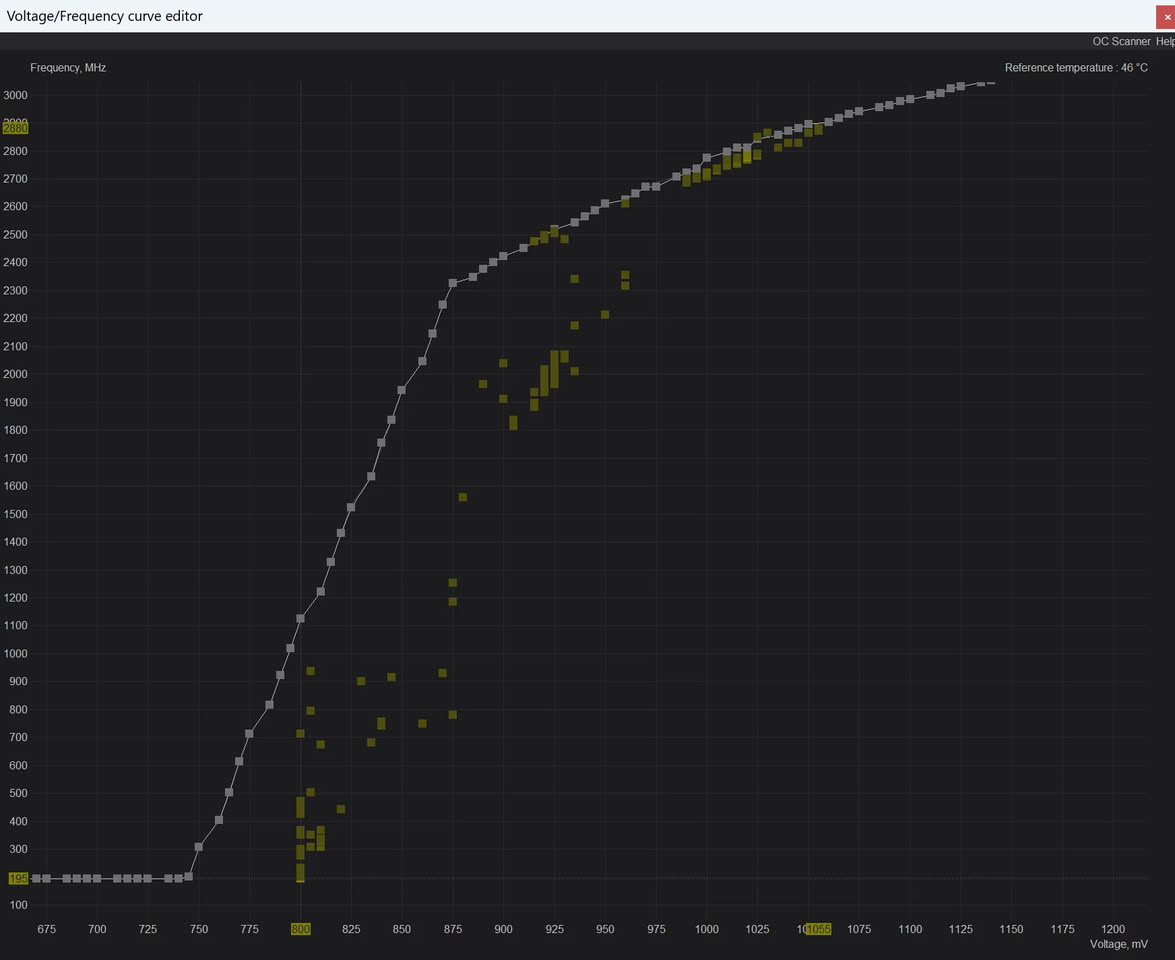
According to "Unwinder," the developer behind MSI Afterburner, the upcoming beta release will allow users to record and visualize the V/F heat map directly within the curve editor. By pressing the "M" key while in the editor, users can capture real-time data showing how their NVIDIA GeForce RTX GPU dynamically adjusts voltage and frequency. This visualization makes it easier to observe the GPU Boost algorithm in action, revealing how the graphics card selects specific voltage points as it scales frequency to meet performance demands.
The heat map uses color gradients—most notably yellow—to indicate the most frequently accessed points on the V/F curve. This feature provides a clear, intuitive way to understand how the GPU responds to different workloads and how often it operates at specific voltage and frequency combinations.
Enhanced Dynamic Voltage Frequency Scaling in NVIDIA Blackwell GPUs
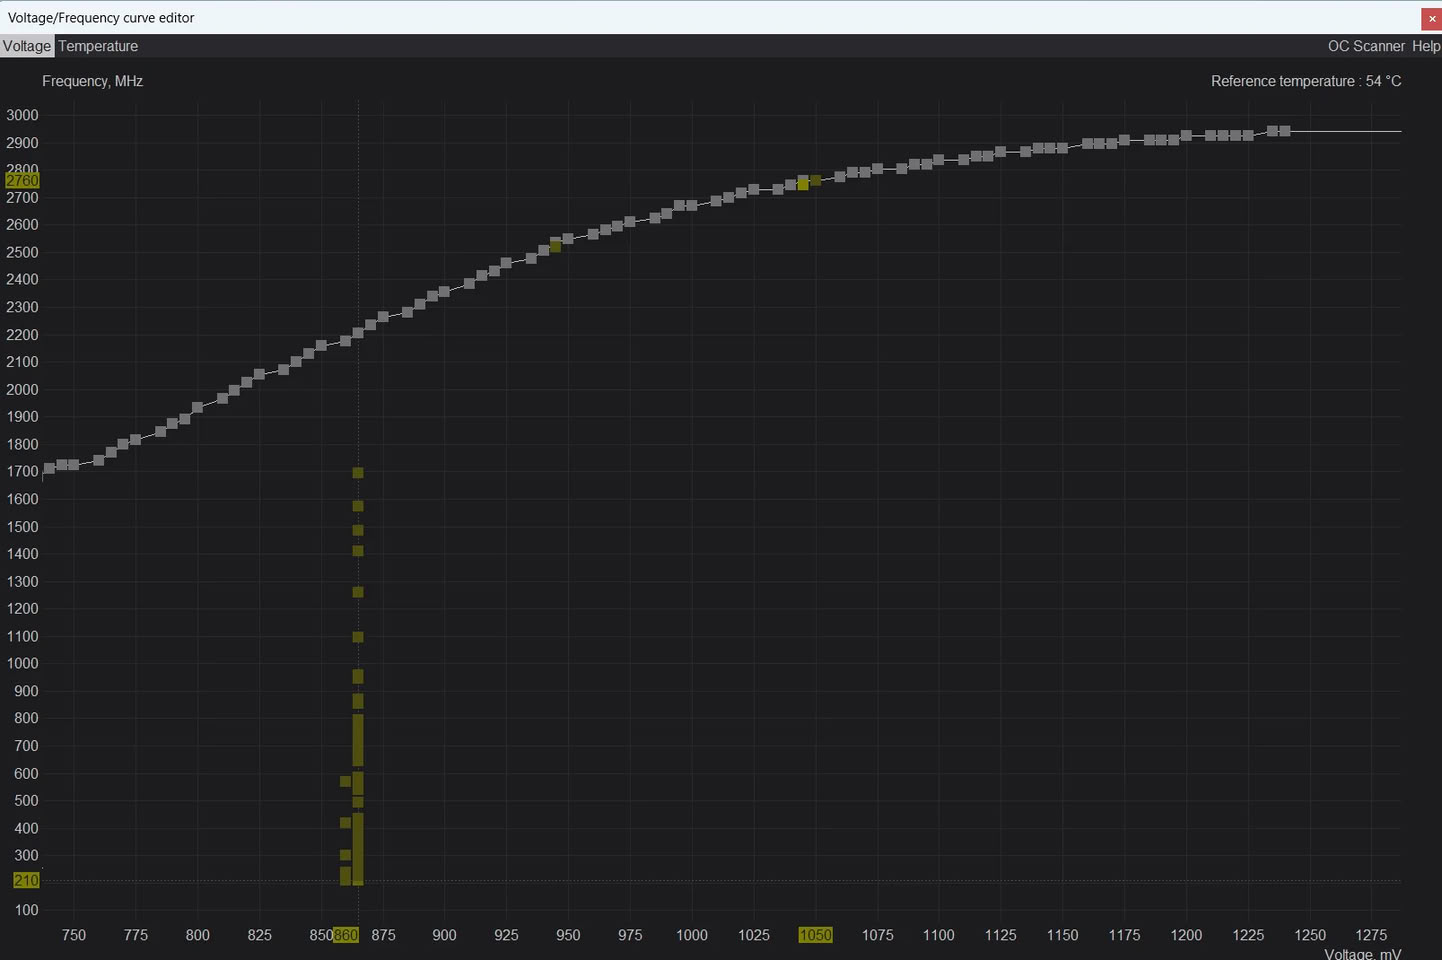
With the introduction of NVIDIA's "Blackwell" architecture, significant improvements have been made to dynamic voltage frequency scaling (DVFS) within the GPU Boost algorithm. In previous GPU generations, such as "Ada Lovelace," the GPU Boost mechanism would switch between predefined V/F points without utilizing intermediate values. However, starting with Blackwell, the transition between voltage and frequency targets is much smoother and up to 1,000 times faster, thanks to advanced DVFS enhancements.
These improvements are clearly visible in the MSI Afterburner beta's heat map feature. For example, the GeForce RTX 5090 demonstrates a more gradual and responsive boosting pattern compared to the GeForce RTX 4090, highlighting the architectural advancements in V/F scaling and DVFS operation between the two generations.
Comparing Visualization Tools for GPU Performance Analysis
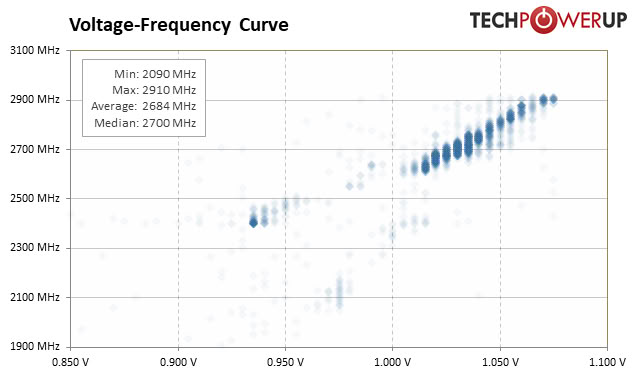
While MSI Afterburner’s new heat map offers a user-friendly way to monitor and analyze GPU voltage and frequency behavior, other tools are also used in the industry for similar purposes. For instance, TechPowerUp employs custom software for their GPU performance visualizations, providing alternative perspectives on how different architectures handle boosting and scaling.
Overall, the addition of the V/F curve heat map in MSI Afterburner represents a significant step forward for enthusiasts and professionals seeking to optimize GPU performance and understand the intricacies of modern graphics card behavior.